5. Bar Charts
Bar charts are one of the most intuitive types of visualizations. As with the rest of the library, Multiplex makes it easier to create more complex types of bar charts.
At the moment, Multiplex supports only horizontal bar charts, not column charts. Horizontal bar charts are slightly better for comparisons and readability because they are read from top to bottom.
Note
Are you looking to create bar chart visualizations, not read the in-depth documentation about them? Multiplex’s Jupyter Notebook examples are a quick guide to get you up and running. Check out the bar chart Jupyter Notebook tutorial to learn how to create your own bar chart visualizations.
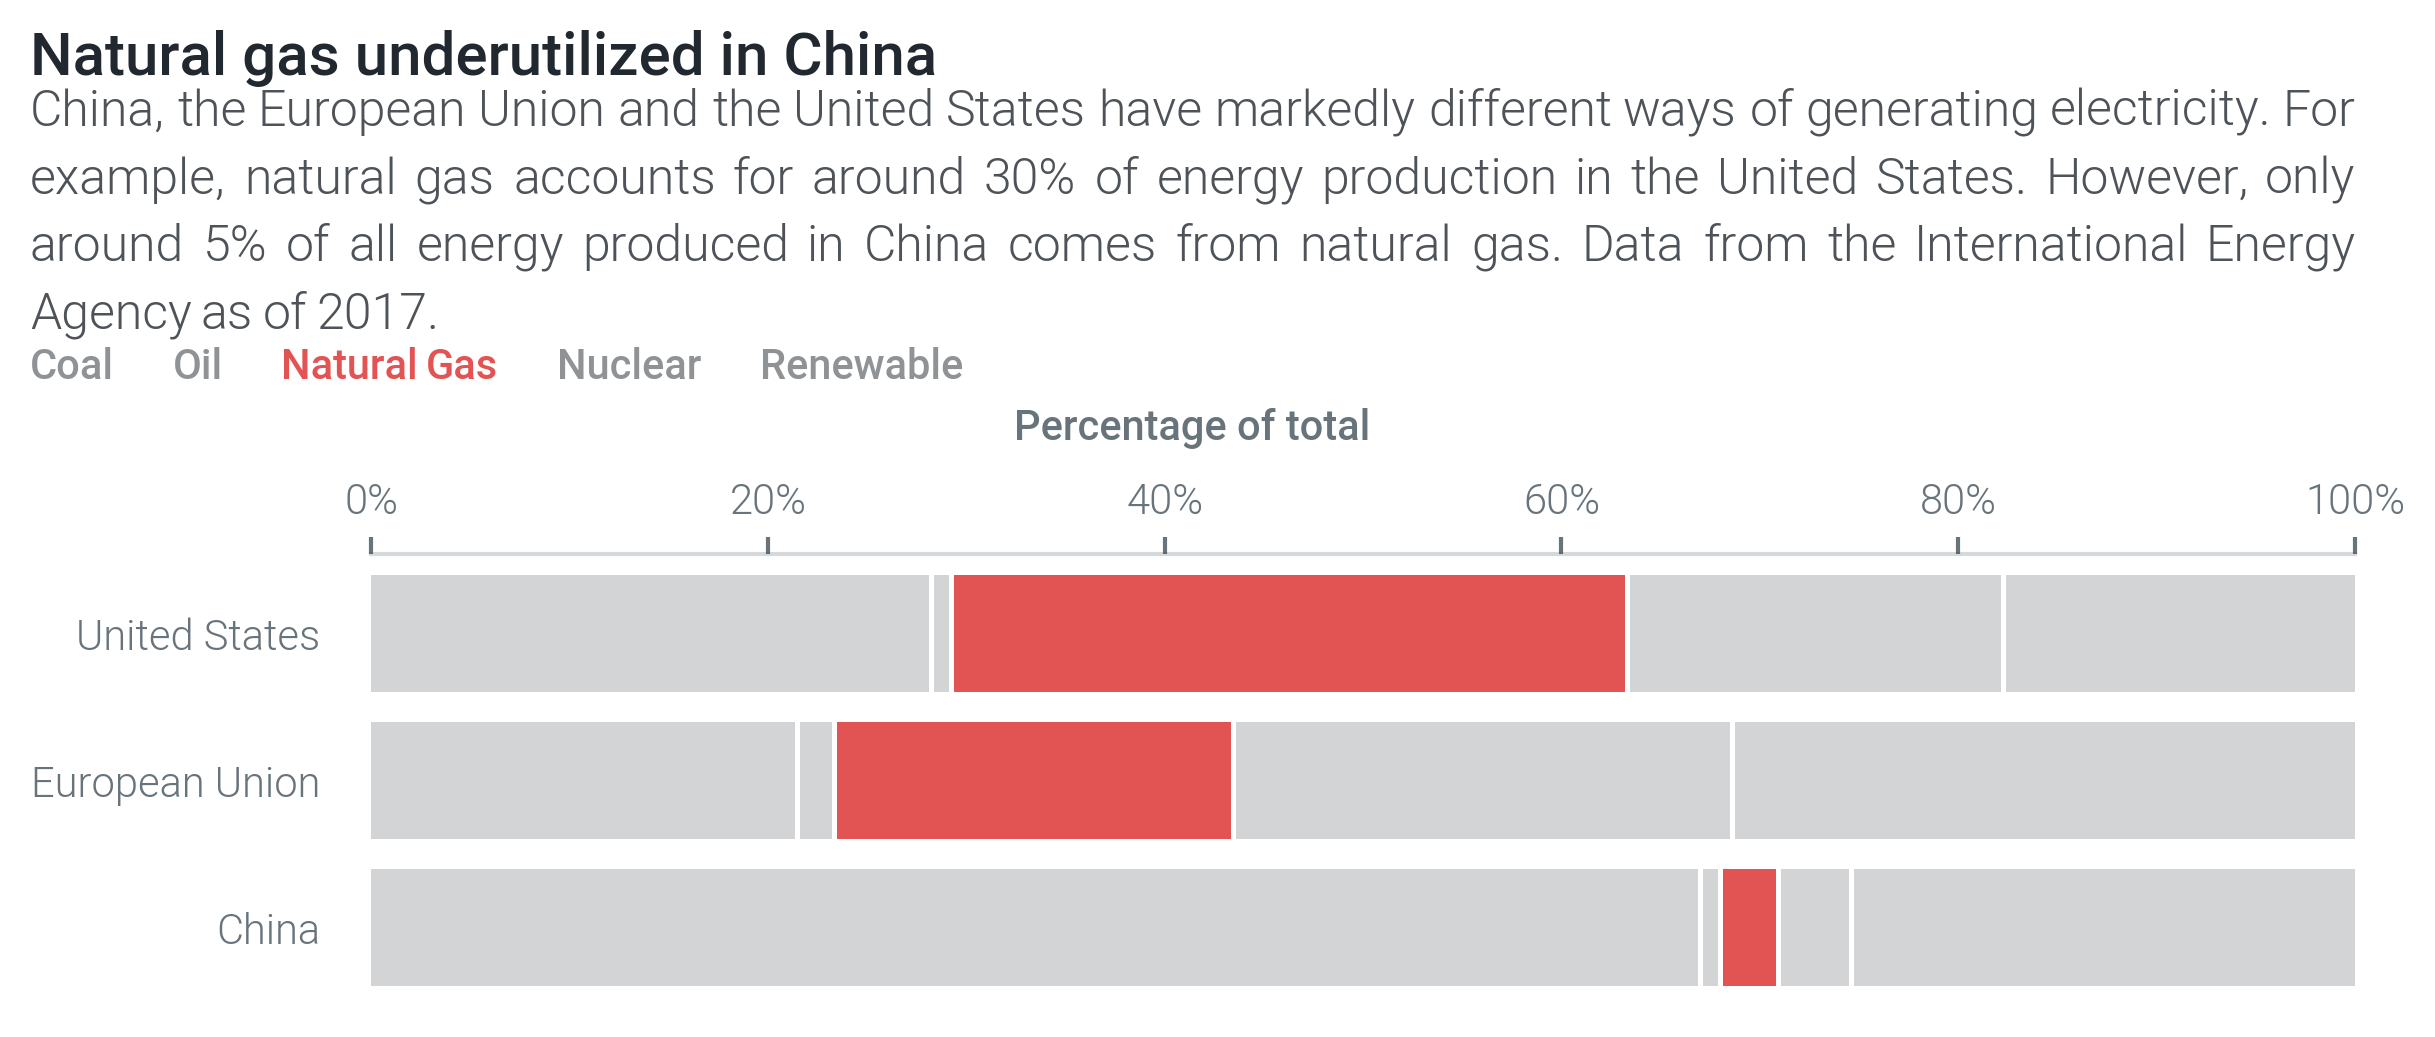
100% Bar Charts
The Bar100 visualization draws stacked bar charts that all add up to 100%.
These types of visualizations are useful to show the make-up of data in terms of percentages.
The Bar100 visualization is based on matplotlib’s barh function.
This class, like the rest of Multiplex’s new visualizations, simplifies the construction of 100% bar chart.
For example, you don’t have to provide percentages; the Bar100 visualization automatically converts numbers to percentages.
For readability, the 100% bar chart visualization also makes a few changes to the plot by:
- Moving the x-axis label to the top of the plot,
- Moving the x-ticks to the top of the plot,
- Converting the x-ticks to percentages, and
- Removing the grid.
It is very easy to create 100% bar charts.
All you have to do is create a Drawable class and call the draw_bar_100() function.
This method expects, at the very least, the values and the name of the 100% bar:
import matplotlib.pyplot as plt
from multiplex import drawable
viz = drawable.Drawable(plt.figure(figsize=(10, 10)))
viz.draw_bar_100([ 5, 2, 4, 7, 3 ], 'bar', alpha=0.5, color='C1')
viz.show()
As usual, you can create more complex visualizations by styling each bar individually and adding legends.
Note
You can view more complex 100% bar chart visualization examples in the bar chart Jupyter Notebook tutorial.
-
class
bar.bar100.Bar100(*args, **kwargs)¶ The 100% bar chart visualization draws bars that, unsurprisingly, always sums up to 100%. Although the 100% bar chart is based on matplotlib’s barh function, the
Bar100visualization does a lot of work behind the scenes to make it easier to create 100% bar charts.This class stores the
Drawableinstance. As usual, the main functionality goes through thedraw()function.The
draw()function receives a list of numbers, converts them to percentages and then draws them. This class keeps track of all the bars that it has drawn in thebarsinstance variable.Variables: bars (list of list of matplotlib.patches.Rectangle) – A list of bars drawn so far. Each bar is split into a number of bars that together add up to 100%.-
__init__(*args, **kwargs)¶ Instantiate the 100% bar chart visualization with an empty list of drawn bars.
-
draw(values, name, style_plot=True, min_percentage=1, pad=0.25, label_style=None, *args, **kwargs)¶ Draws a bar on the
Drawablethat spans 100% of the x-axis. The function automatically converts the given values into percentages.The values can be provided either as a list of floats or as a list of dictionaries. If floats are provided, the function automatically converts them into dictionaries. Dictionaries should have the following format:
{
  'value': 10,
  'style': { 'color': 'C1' },
  'label': None
}
Of these keys, only the
valueis required.If you provide a
label, the function automatically adds a legend for the bar.You can use the
styleto override the general styling options, which you can specify askwargs. The accepted styling options are those supported by the matplotlib.pyplot.barh method.Use the
kwargsas a general style, and the dictionary’sstyleas a specific style for each bar. If you specify akwargsstyling option, but it is missing from the dictionary’sstyle, the general style is used.Note
For example, imagine you specify the bar
colorto beblueand thealphato be0.2in the**kwargs. If in the dictionary’sstyleof a particular bar you set thealphato be1, the bar will be opaque. However, since thecoloris not specified, it will use the general color:blue.Parameters: - values (list of float or list of dict) – A list of values to draw.
The visualization expects a
listof floats or alistofdictinstances as shown above. - name (str) – The name of the 100% bar chart. The function automatically adds this name to the y-axis tick labels next to the drawn bar.
- style_plot (bool) –
A boolean indicating whether the plot should be re-styled. If it is set to
True, the visualization:- Moves the x-axis label to the top of the plot,
- Moves the x-ticks to the top of the plot,
- Converts the x-ticks to percentages, and
- Removes the grid.
- min_percentage (float) – The minimum percentage to show in the 100% bar chart. This is used so that bars with 0% percentage are still shown with a very thin bar.
- pad (float) – The amount of padding, in percentage, to apply to the given value. This padding will be split equally on the left and right of the bar. In any case, the padding cannot reduce a bar to below the minimum percentage.
- label_style (dict or None) – The style of the label.
By default, the label inherits the style from the
kwargsso that the label is visually similar to the bar. Thelabel_styleaccepts any styling option supported by theAnnotation’sdraw()function.
Returns: The list of drawn bars. These bars are ordered in the same way as the provided values. Together, they add up to 100%.
Return type: list of
matplotlib.patches.RectangleRaises: - ValueError – When no values are given.
- ValueError – When all values are zero.
- ValueError – When any value is negative.
- ValueError – When the name is empty.
- ValueError – When the minimum percentage is below 0% or above 100%.
- ValueError – When the minimum percentage multiplied by all values exceeds 100%.
- ValueError – When the padding is higher than the percentage.
- values (list of float or list of dict) – A list of values to draw.
The visualization expects a
-