6. Slope Graph
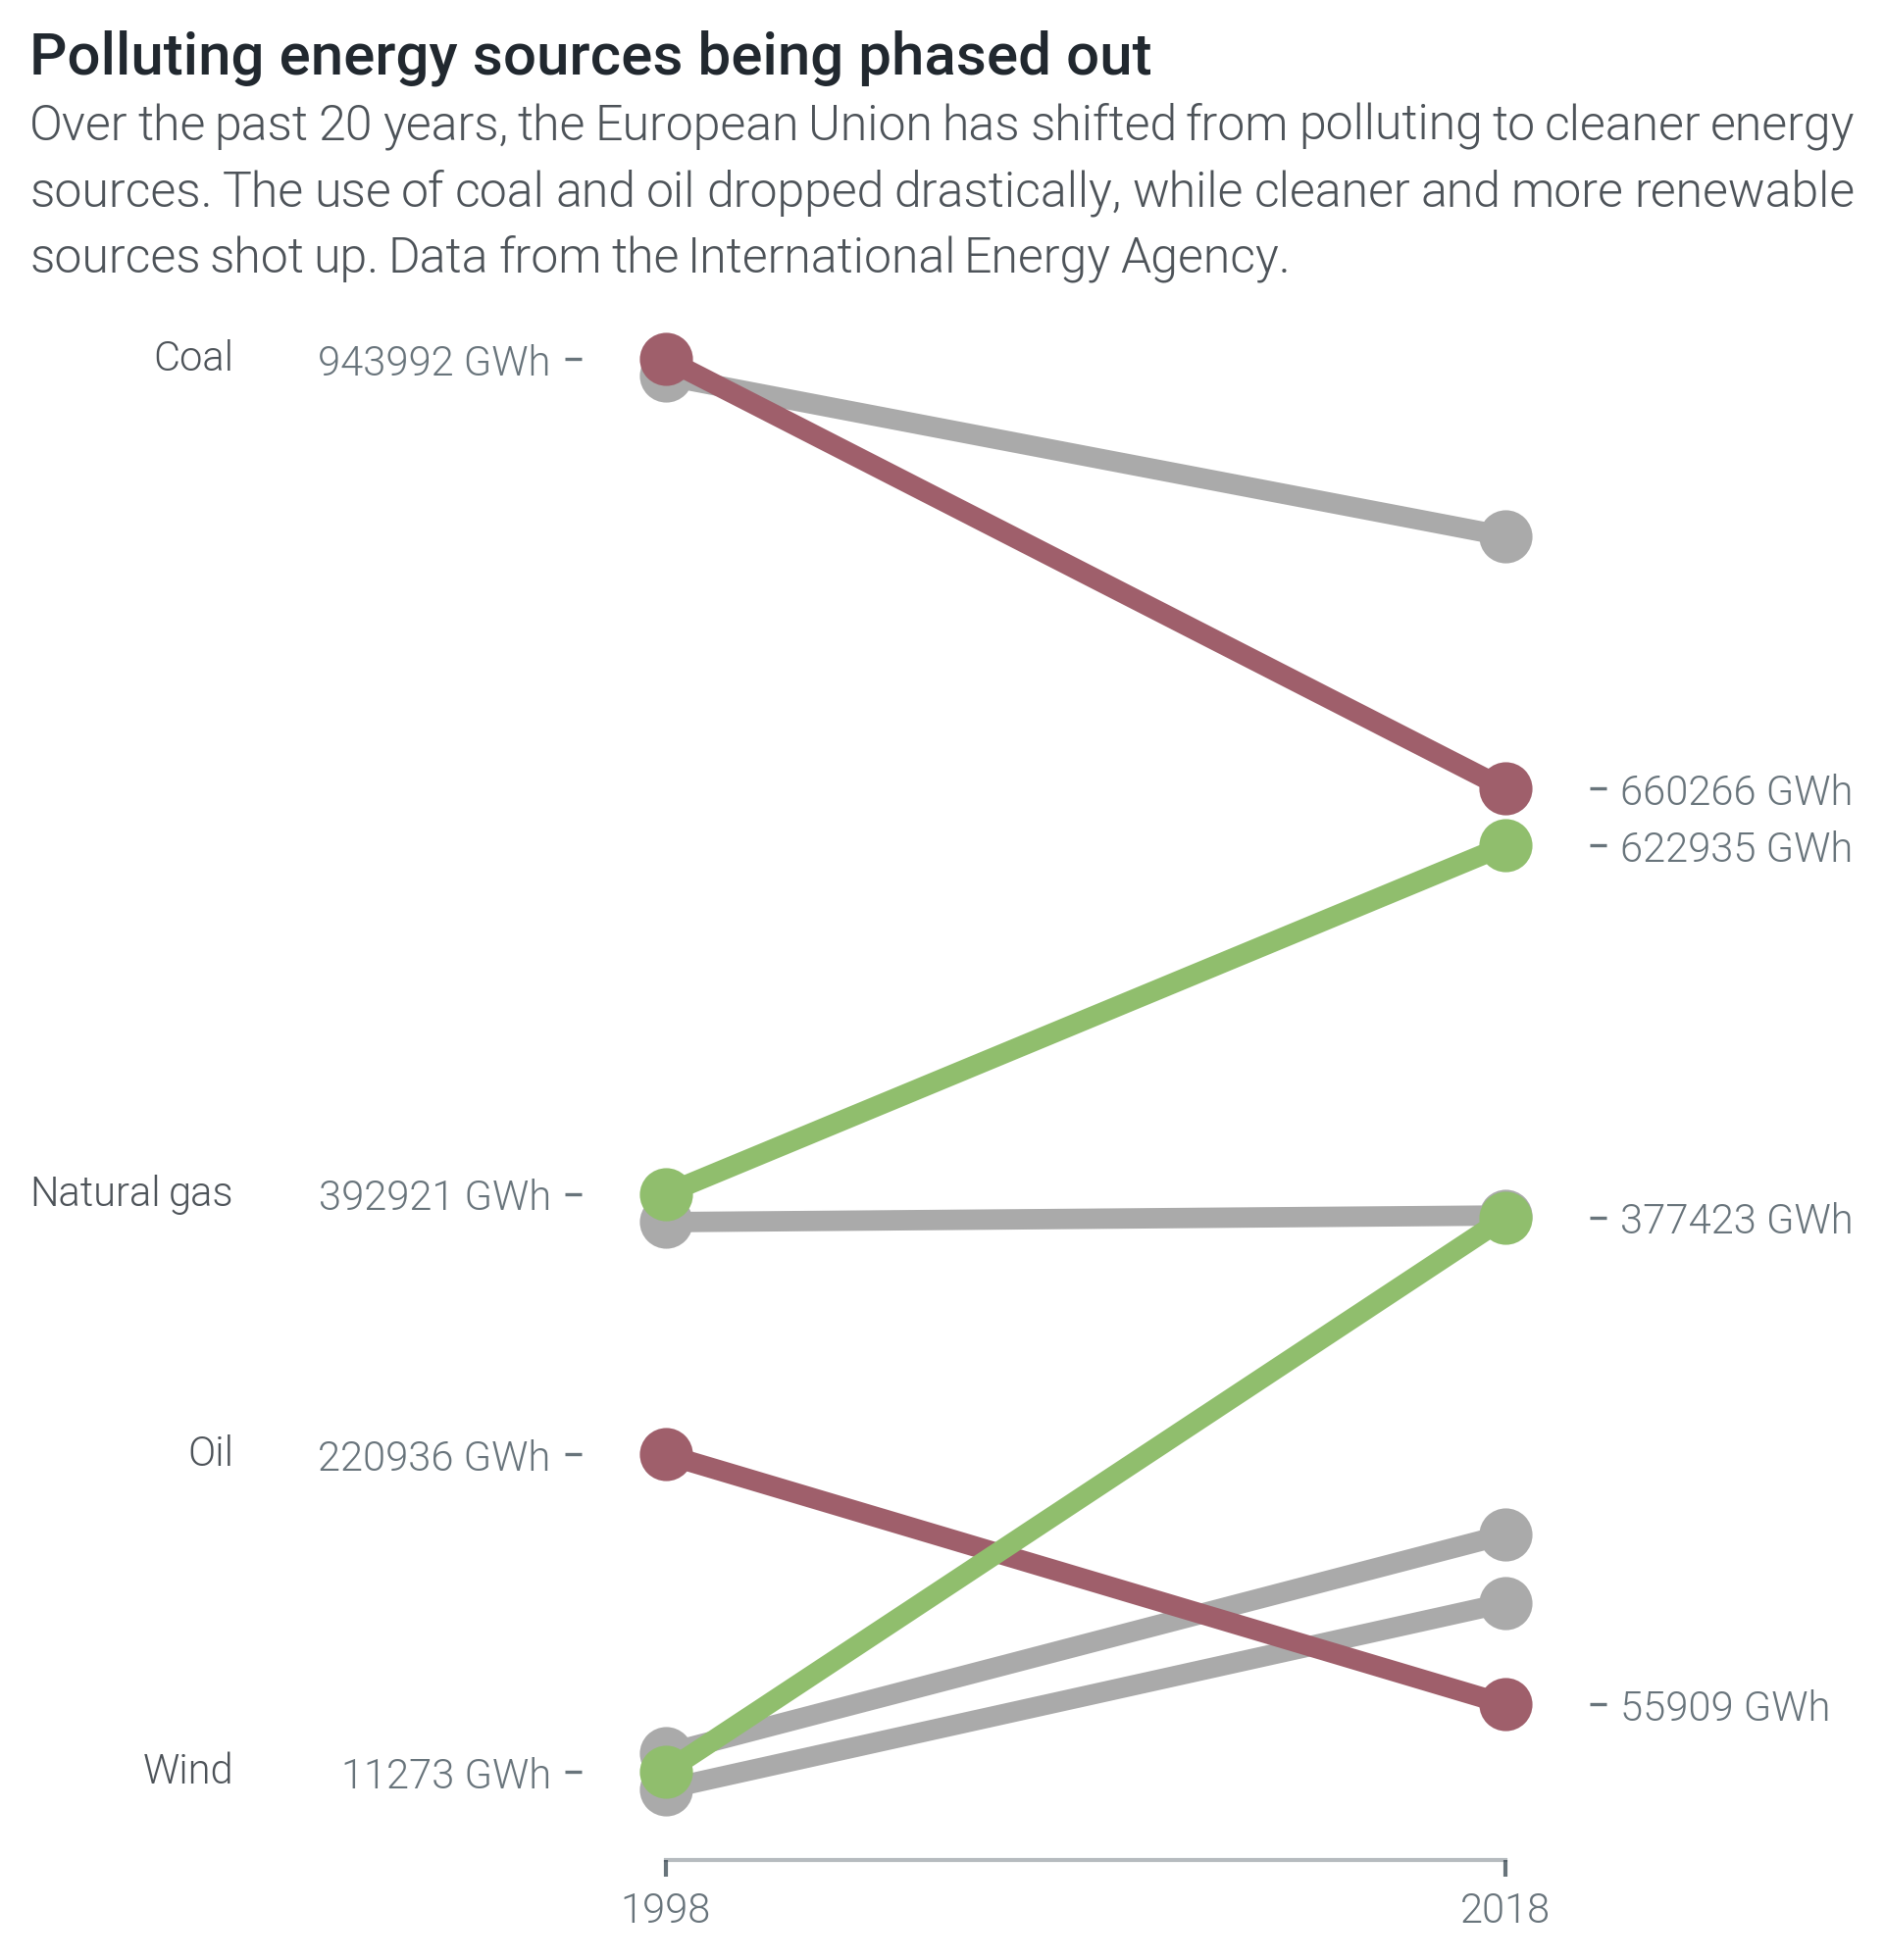
Data can change as a result of time, action or a plethora of other reasons. Although not as common as other visualizations, slope graphs are great to show how data changes. Multiplex’s slope graph makes it easier to show how data changes and tell a story.
Note
Can’t wait to start creating slope graphs? Multiplex’s Jupyter Notebook examples are a quick guide to get you up and running. Check out the slope graphs Jupyter Notebook tutorial to learn how to create the time series shown above, or to start creating your own slope graph visualizations.
The Slope class allows you to create slope graphs that show how values changed, such as:
- Before and after an operation, or
- Over a time period.
Slope graphs are not commonly included in visualization packages, but they can be great tools to tell a story.
To draw a slope graph, create a Drawable class and call the draw_slope() function:
import matplotlib.pyplot as plt
from multiplex import drawable
viz = drawable.Drawable(plt.figure(figsize=(10, 10)))
viz.draw_slope(5, 5)
viz.show()
You can also draw multiple slopes at the same time by providing a list instead:
viz = drawable.Drawable(plt.figure(figsize=(10, 10)))
viz.draw_slope([ 0, 3 ], [ 5, 2 ])
In addition to the slopes, you can also provide the ticks on both sides. Ticks can be:
None(default): Adds the values as ticks,- Empty string: Add no ticks, or
- Other (such as a string): Add the given value as a label.
For example, the following snippet adds a tick with label ‘0’ on the left y-axis, and a tick with label ‘3’ on the right y-axis.
viz = drawable.Drawable(plt.figure(figsize=(10, 10)))
viz.draw_slope(0, 3, y1_tick=None, y2_tick=None)
Multiplex overwrites ticks if you provide None or a value for the tick labels, but not if you provide an empty string.
If you are creating multiple slopes at the same time, None and the empty string apply for all slopes.
You can, however, provide a list of ticks labels corresponding to each slope.
For example, the next snippet adds ‘A’ and ‘B’ on the left y-axis, and ‘3’ and ‘5’ as ticks on the right y-axis.
viz = drawable.Drawable(plt.figure(figsize=(10, 10)))
viz.draw_slope([ 0, 1 ], [ 3, 5 ], y1_tick=[ 'A', 'B' ], y2_tick=None)
-
class
slope.slope.Slope(*args, **kwargs)¶ The
Slopeclass builds on theLabelledVisualization. The reason behind this is that each slope in the visualization has a label associated with it. In these cases, theLabelledVisualizationautomatically ensures that the labels do not overlap.Like all visualizations, it revolves around the
draw()function.Variables: - slopes (list of
matplotlib.lines.Line2D) – The drawn slopes. - llabels (list of
Annotation) – The slope labels on the left. - rlabels (list of
Annotation) – The slope labels on the right.
-
__init__(*args, **kwargs)¶ Initialize the slope graph with a drawable. This function also creates a container for all the drawn slopes.
-
draw(y1, y2, y1_tick=None, y2_tick=None, label=None, where='both', label_style=None, style_plot=True, *args, **kwargs)¶ Draw a slope graph. The function returns a two-tuple with the drawn plot (a line with optional markers) and any drawn labels.
Any additional arguments and keyword arguments are used as styling options. The accepted styling options are those supported by the matplotlib.pyplot.plot method.
Parameters: - y1 (float or list of float) – The start value of the slope, or a list of start values.
- y2 (float or list of float) – The end value of the slope, or a list of end values.
- y1_tick (None or str or list) –
The tick label to show on the left side, which can be:
None(default): Adds the values as ticks,- Empty string: Add no ticks, or
- Other (such as a string): Add the given value as a label.
If you are drawing a list of slopes, you can provide a list. This list too can be made up of
None, empty strings or any other value with the same behavior as above. - y2_tick (None or str or list) –
The tick label to show on the right side, which can be:
None(default): Adds the values as ticks,- Empty string: Add no ticks, or
- Other (such as a string): Add the given value as a label.
If you are drawing a list of slopes, you can provide a list. This list too can be made up of
None, empty strings or any other value with the same behavior as above. - label (None or str or list) – The slope’s label.
The label is different from the ticks: ticks show values, labels show the name of the slope.
If
Noneor an empty string is given, no labels added. If you provide a list of slopes, you can also provide a list of labels: one for each slope. - label_style (dict or None) – The style of the labels.
The
label_styleaccepts any styling option supported by theAnnotation’sdraw()function. - where (str or list of str) –
The position of the labels:
left,rightorboth. Ifleftis given, the labels are added to the primary (left) axes. Ifrightis given, the labels are added to the secondary (right) axes. Ifbothis given, the labels are added to both axes.If multiple labels are given, one
wherecan be provided for each label as a list. - style_plot (bool) –
A boolean indicating whether the plot should be re-styled. If it is set to
True, the visualization:- Removes the grid,
- Hides the x-axis
- Hides the y-axis, and
- Adds two x-ticks.
Returns: A tuple containing the drawn plot, any drawn labels on the left, and any drawn labels on the right.
Return type: tuple (
matplotlib.lines.Line2D, list ofAnnotation, list ofAnnotation)Raises: - ValueError – If the
y1andy2parameters are lists of unequal length. - ValueError – If the number of start points and start tick labels are not equal.
- ValueError – If the number of end points and end tick labels are not equal.
- ValueError – If the number of slopes and labels are not equal.
- ValueError – If the label position is unknown (not
leftorright,both).
- slopes (list of